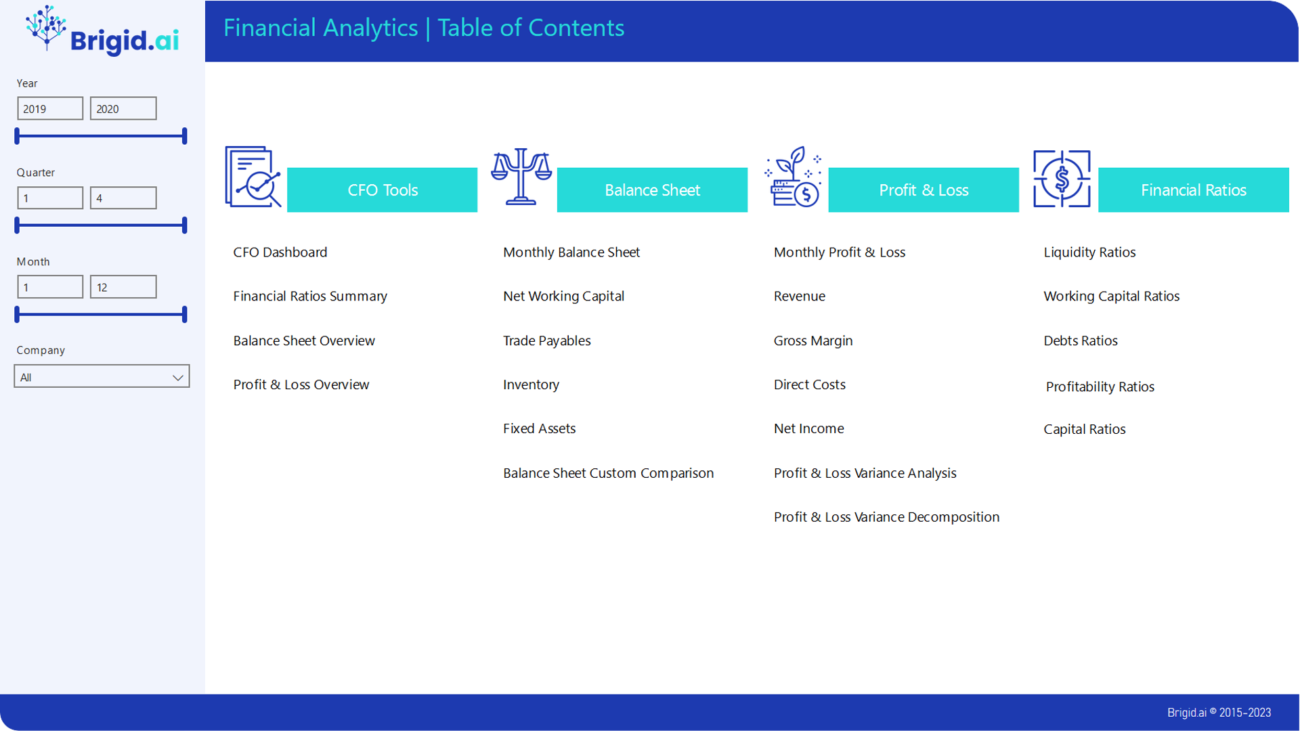
We offer easy-to-use analytical reporting solution based on Microsoft Power BI that makes all your financial data visual and transparent. It can be used as a tool for investigation and analysis, as well as a beautiful and understandable set of reports that can be presented to senior management or the Board of directors. These reports help both financial professionals and company management always have a clear understanding of the financial performance and market position of the organization, tracking the main trends, market factors and strategic position.
As you know, you can not manage what is not measured. With our financial dashboard, you will always have clear operational information and be able to make quick decisions, improving organizational results.
Balance Sheet
Review your balance sheet in total and compared to a chosen period. Easily visualise trends at a line item and dimensional level to guide further investigation or corrective action. A second report page presents the same data by month, helping you to observe the values in you balance sheet as they move across periods to better compare trends over time across all line items in unison, and to see whether movements in one line impact another.
Net Working Capital
Understand the detail of your net working capital position – the mix of assets and liabilities and the more detailed components – click to see trends by dimension and within components to identify what might be driving levels too high or too low.
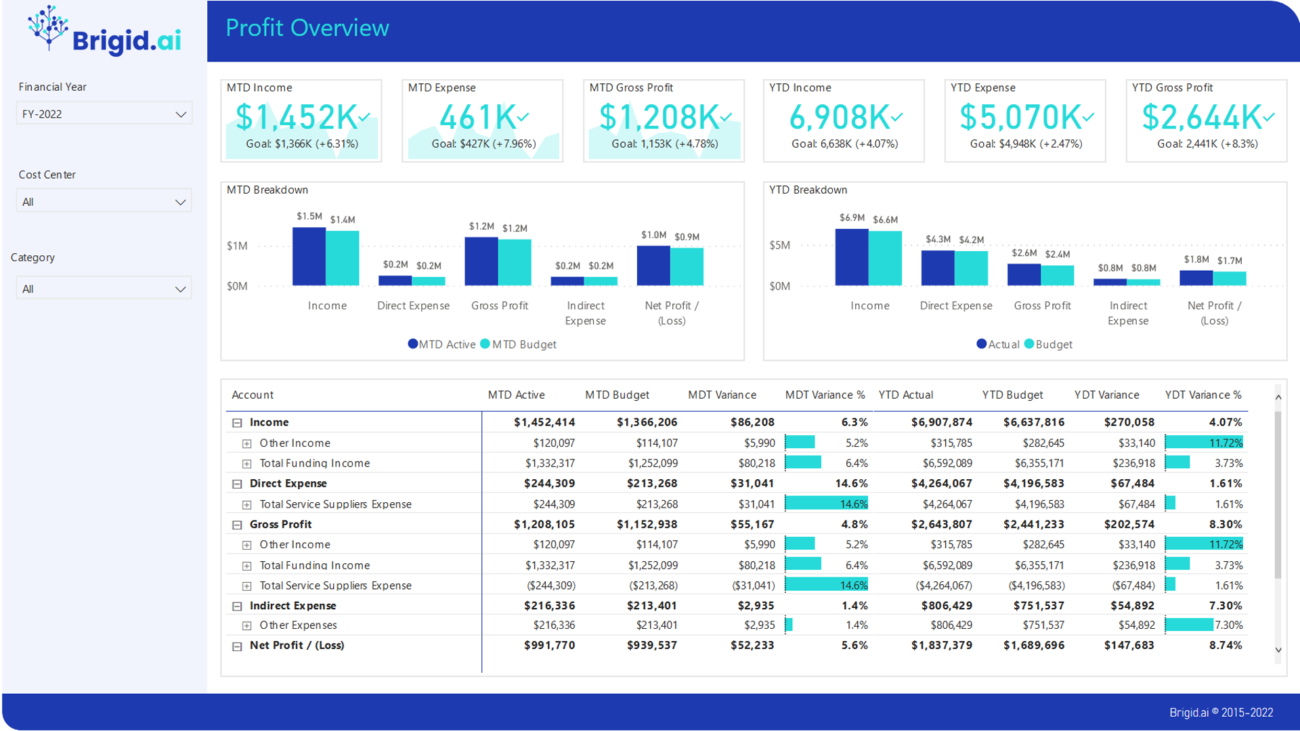
Profit & Loss
Review your P&L in total and compared to a chosen period. Easily visualise trends at a line item and dimensional level to guide further investigation or corrective action. A second report page presents the same data by month, helping you to observe the values in your P&L as they move across periods to better compare trends over time across all line items in unison, and to see whether movements in one line impact another.
Ratios
Get an overarching view of the financial health and trends in your business based on a broad set of standard financial ratios. Use slicers to filter for different periods, and to cut your data based on your existing financial dimensions.
Monitor the liquidity trends in your business to ensure you have sufficient assets to meet your immediate short term debt requirements.
Monitor the working capital trends in your business to ensure your inventory is under control, that you’re maximising your creditor terms, and collecting cash from customers.
Monitor your level of debt in the balance sheet, see debt relative to your earnings and ability to cover interest costs.
Monitor trends in your core profitability results, relative to your revenue, to ensure you manage profit drivers before they become issues.
Monitor the trends in the capital structure and performance of your business – how hard your assets are working for you and your returns on investment.
Review your Profit & Loss in total and compared to a chosen period. Easily visualise trends at a line item and dimensional level to guide further investigation or corrective action. Report presents the same data by month, helping you to observe the values in your P&L as they move across periods to better compare trends over time across all line items in unison, and to see whether movements in one line impact another.
For P&L you can separately explore the detail of revenue, margins, operating expenditure and profit, with the ability to switch to a ‘% of revenue’ view with a simple slicer selection
Profit & Loss packages based on Microsoft Power BI equip managers and other stakeholders with intuitive and easy-to-use tools foe decision-making.
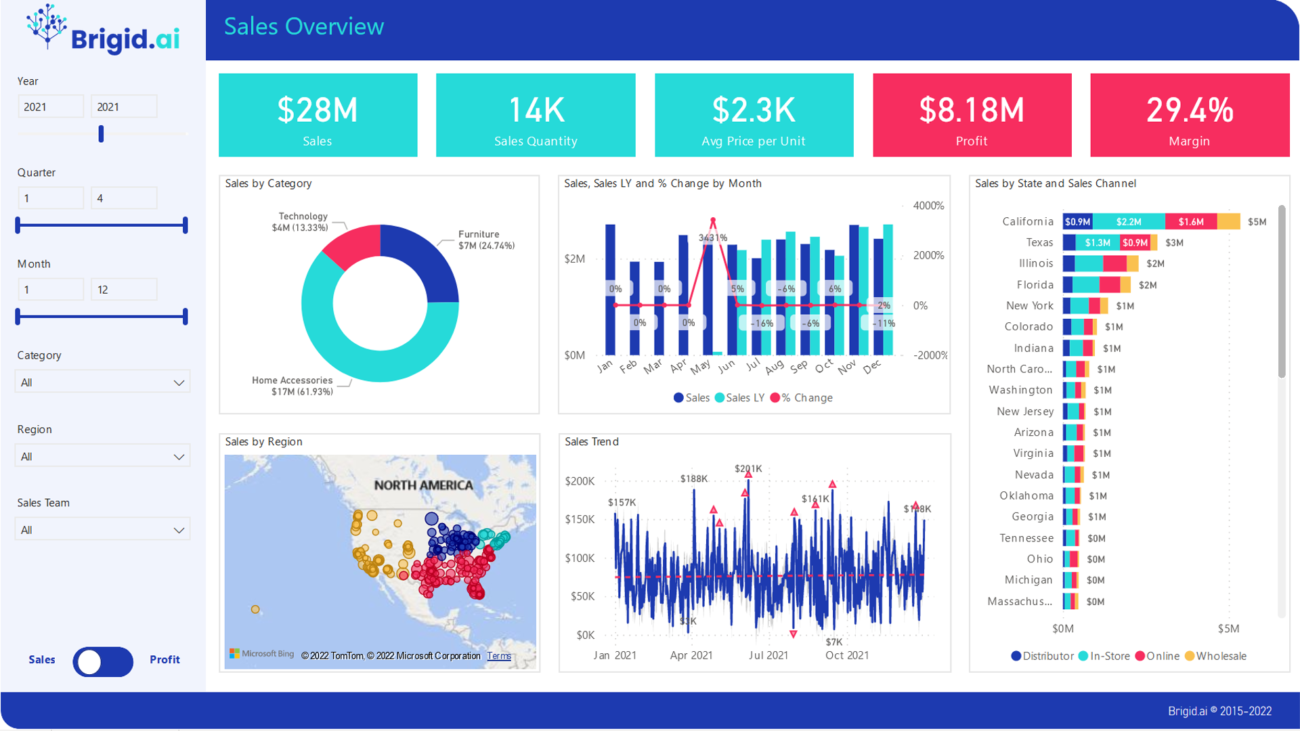
Winning new business is of utter importance in any economic situation and for any organisation. Our Sales Dashboards based on Microsoft Power BI can help you to accelerate analysis and make decision-making data driven.
You will have a detailed view of your pipeline and opportunities – all visual and actionable.