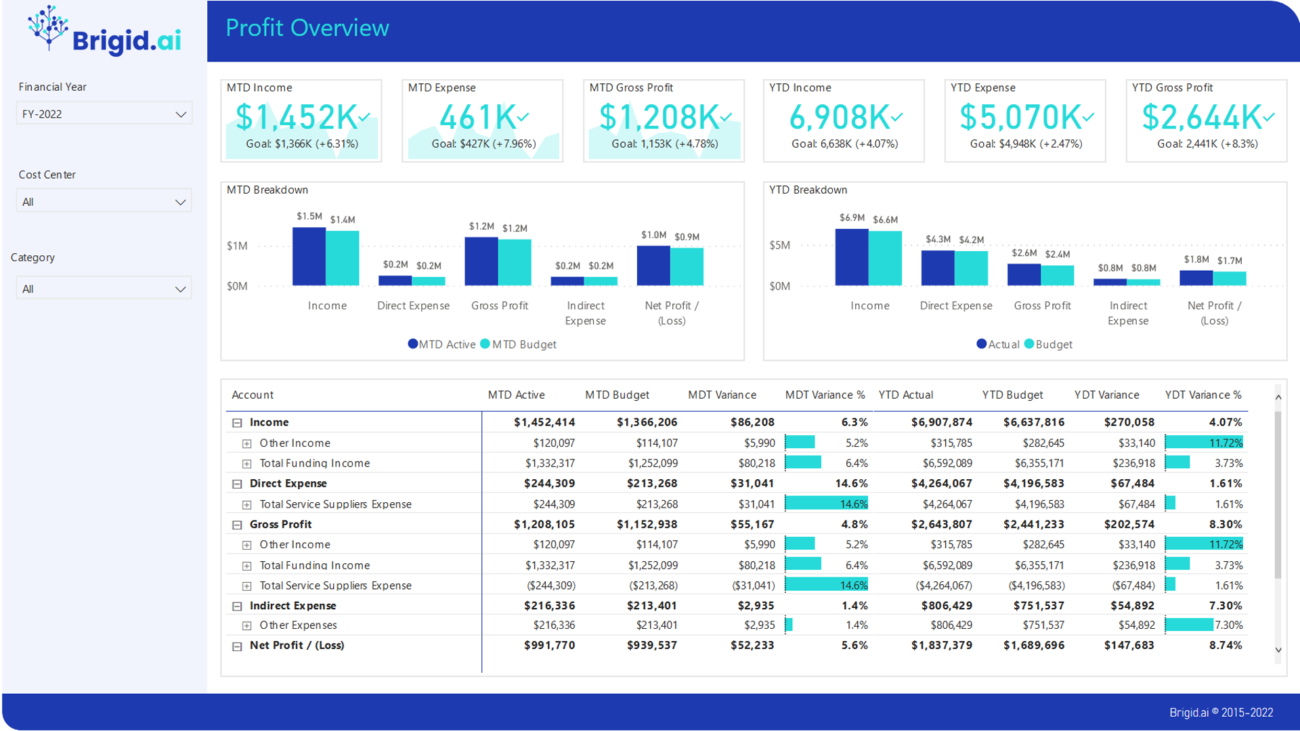
Review your Profit & Loss in total and compared to a chosen period. Easily visualise trends at a line item and dimensional level to guide further investigation or corrective action. Report presents the same data by month, helping you to observe the values in your P&L as they move across periods to better compare trends over time across all line items in unison, and to see whether movements in one line impact another.
For P&L you can separately explore the detail of revenue, margins, operating expenditure and profit, with the ability to switch to a ‘% of revenue’ view with a simple slicer selection
Profit & Loss packages based on Microsoft Power BI equip managers and other stakeholders with intuitive and easy-to-use tools foe decision-making.