Our prebuilt Power BI packages help HR professionals to start get insights from the data they have in minutes, not weeks. Visualisations make data clear and transparent and make data-driven decisions. Data-driven decisions help to improve ROI by attracting, managing, and retaining employees.
Data-driven decisions of HR professionals based on Power BI analytics also help to maximise productivity, make working environments better and employees more engaged.
Demography
This dashboard contains headcount and geographical analysis of employees from the point of view of each different business units.
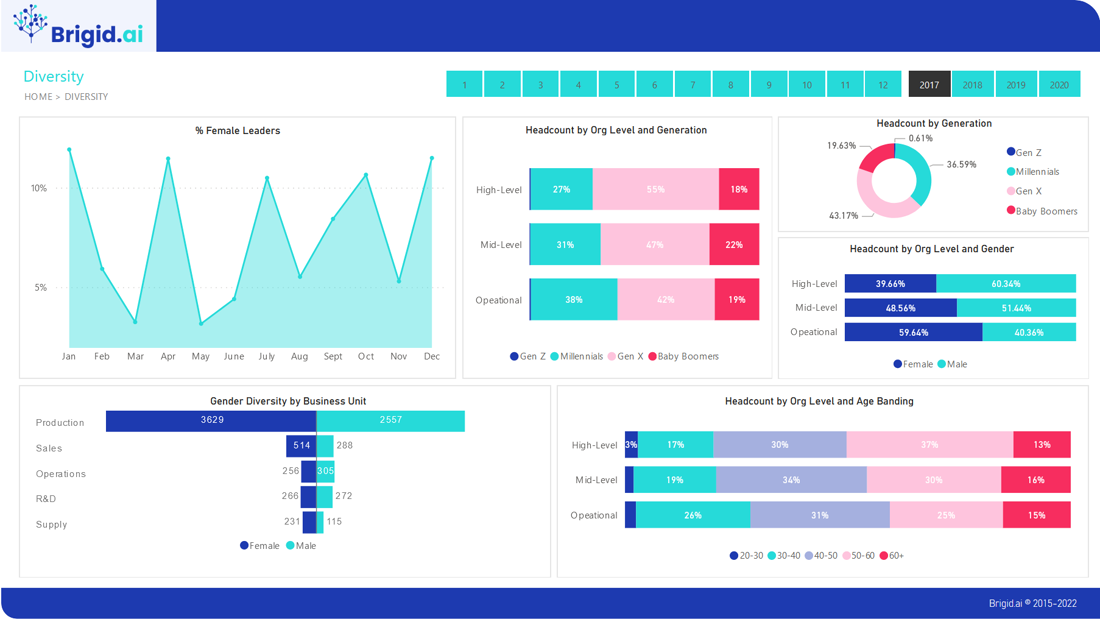
Diversity
Using an interactive dashboard, HR professionals can dig deeper into demographic data and analyse one variable, such as ethnic diversity. This dashboard shows the different metrics on the diversity of the company like women in senior level positions, number of employees by generation, etc.
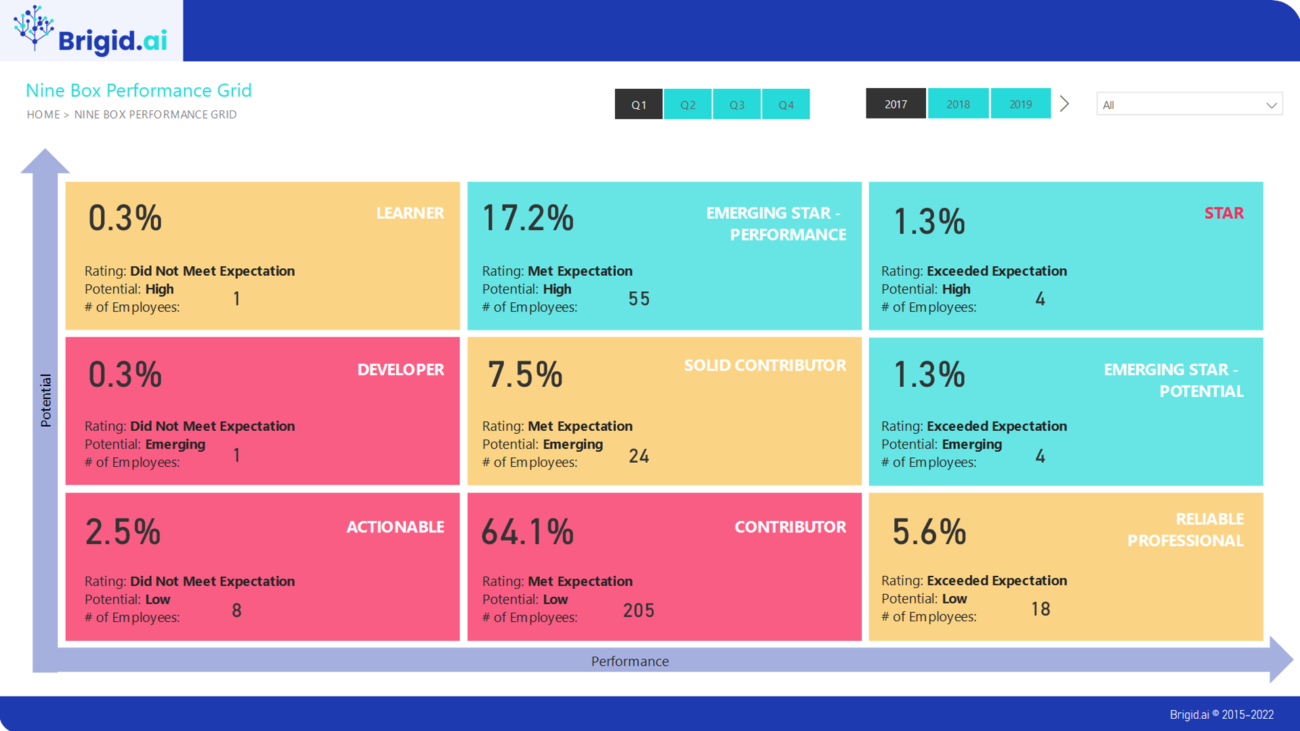
Historical & Trends
Historical & Trends dashboards help HR teams and business managers understand the trend analysis of employees, hires, terminations, attrition.
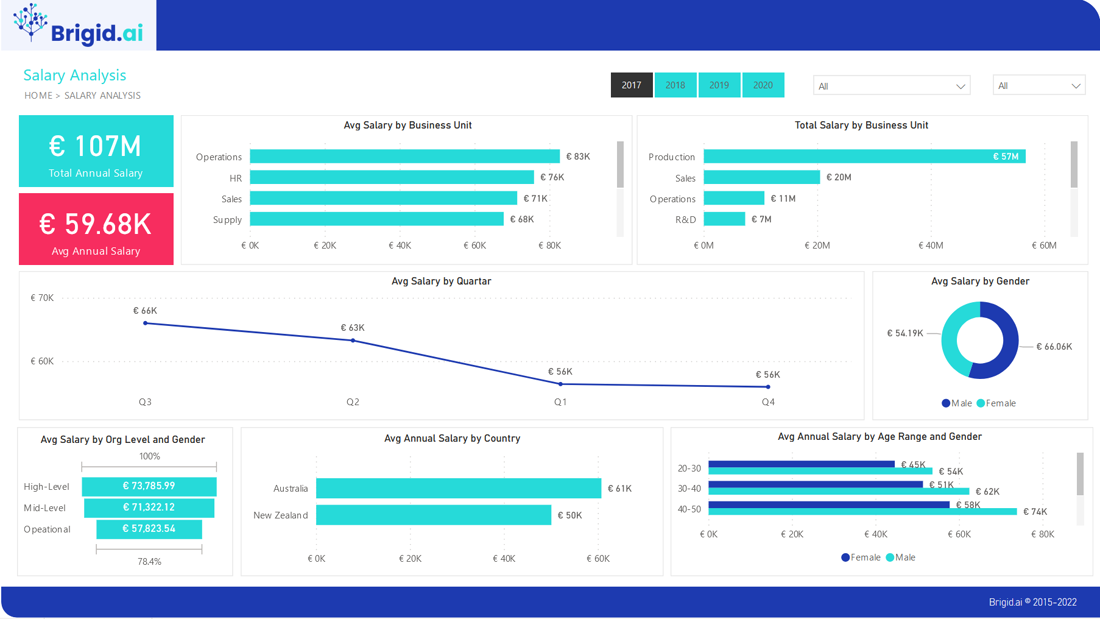
Salary Analysis
It contains an average salary analysis in different categories. For example, business unit, month, gender, age range, seniority, location.
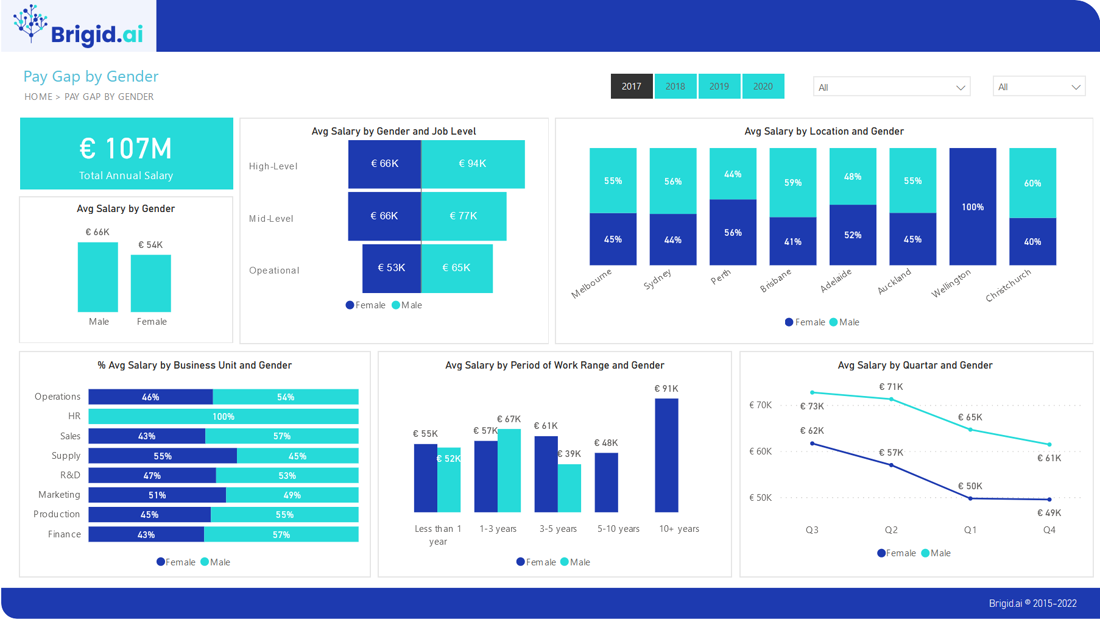
Gender Pay Gap
The Gender Pay Gap refers to the difference in the average hourly pay of women compared to men in a particular organisation and is designed to capture the extent to which women are evenly represented across an organisation. Employers need to be aware that where a gender pay gap exists, this may negatively impact their brand, employee relations, public reputation and their ability to attract and retain talent.
Training
Employees are the most important asset within an organization. This HR dashboard contains an analysis of training and the cost in different categories. For example, department and training type.
Modern organisations pay more and more attention to Diversity and Inclusion. This is not only important from the point of the compliance, but also as a means to send a clear signal of commitment to Diversity and Inclusion to employees.
Our prebuilt Power BI packages for Diversity and Inclusion reporting and communication will make this signal clear and powerful.
Demography
This dashboard contains headcount and geographical analysis of employees from the point of view of each different business units.
Diversity
Using an interactive dashboard, HR professionals can dig deeper into demographic data and analyse one variable, such as ethnic diversity. This dashboard shows the different metrics on the diversity of the company like women in senior level positions, number of employees by generation, etc.
Salary Analysis
It contains an average salary analysis in different categories. For example, business unit, month, gender, age range, seniority, location.
Gender Pay Gap
The Gender Pay Gap refers to the difference in the average hourly pay of women compared to men in a particular organisation and is designed to capture the extent to which women are evenly represented across an organisation. Employers need to be aware that where a gender pay gap exists, this may negatively impact their brand, employee relations, public reputation and their ability to attract and retain talent.